
Introduction
De Bruijn graphs, named after Dutch mathematician Nicolaas Govert de Bruijn, are invaluable in both computer science and bioinformatics. These graphs efficiently represent overlaps between sequences of symbols, making them essential for sequence analysis applications. While their utility spans various fields, they are predominantly applied in bioinformatics today. We have even recently demonstrated that they also have applications in encoding time series data as well. This tutorial will show you the construction algorithm of a general purpose de Bruijn Graph.
de Bruijn Graph Construction
A de Bruijn graph (dBG) is a directed weighted graph constructed by encoding all possible subsequences (tuples) of a given set of sequences with a specified length 

The adjacent image demonstrates the dBG construction for a protein sequence 


Implementing de Bruijn Graphs
Notice how a dBG can be constructed over any discrete sequence using a simple sliding window algorithm. This section demonstrates a general-purpose Python implementation of a dBG.
For this implementation, we will use the NetworkX package. We will also use the Matplotlib package for visualization. Both packages are compatible with most Python 3.x versions. You can install them by running the following command:
> pip install networkx, matplotlib1- Let’s start by writing an initialization code for the dBG.
class DeBruijnGraph:
    def __init__(self, k: int, alphabet: set = None):
        """
        Initializes an empty De Bruijn graph.

        :param k: Edge tuple (subsequence) size of the de Bruijn graph. The node tuple size is (k - 1)
        :type k: int
        :param alphabet: Alphabet to be used for the deBruijn graph. Initialized as empty set by default.
        :type alphabet: set
        """
        self.k = k
        self.sequences = list()
        self.graph = nx.DiGraph()

        if alphabet is None:
            self.alphabet = set()
        else:
            self.alphabet = alphabet

    def __str__(self):
        """
        :return: String representation of the class
        """
        return f"{self.__class__.__name__} with " \
               f"{self.graph.number_of_nodes()} nodes " \
               f"and {self.graph.number_of_edges()} edges"
2- Function to create an edge out of a source and a target nodes.
def generate_edge(source, target):
    return tuple(source[0]) + target
3- A general purpose sliding window iterator to help with the dBG construction.
from itertools import islice

def sliding_window(sequence, window_size: int):
    """
    Generate a sliding window over a given sequence.

    This function takes a sequence (like a list or a string) and a window size,
    and generates a new sequence of 'windows', where each window is a tuple of `window_size`
    consecutive elements from the original sequence.

    :param sequence: The sequence to generate the sliding window over. This should be an
                     iterable like a list or a string.
    :type sequence: iterable
    :param window_size: The size of the sliding window. This should be a positive integer.
    :type window_size: int
    :return: An iterator that yields tuples of `window_size` consecutive elements from `sequence`.
    :rtype: iterator
    """
    it = iter(sequence)

    result = tuple(islice(it, window_size))
    if len(result) == window_size:
        yield result
    for elem in it:
        result = result[1:] + (elem,)
        yield result
4- Now let’s put everything together and implement the construction algorithm (highlighted in code).
import networkx as nx

from itertools import islice


class DeBruijnGraph:
    def __init__(self, k: int, alphabet: set = None):
        """
        Initializes an empty De Bruijn graph.

        :param k: Edge tuple (subsequence) size of the de Bruijn graph. The node tuple size is (k - 1)
        :type k: int
        :param alphabet: Alphabet to be used for the deBruijn graph. Initialized as empty set by default.
        :type alphabet: set
        """
        self.k = k
        self.sequences = list()
        self.graph = nx.DiGraph()

        if alphabet is None:
            self.alphabet = set()
        else:
            self.alphabet = alphabet

    def __str__(self):
        """
        :return: String representation of the class
        """
        return f"{self.__class__.__name__} with " \
               f"{self.graph.number_of_nodes()} nodes " \
               f"and {self.graph.number_of_edges()} edges"

    def _init_alphabet(self):
        """
        Initializes the alphabet used in the sequences.

        :return: A set of unique characters found in the sequences.
        :rtype: set
        """
        alphabet = set()
        for sequence in self.sequences:
            for character in sequence:
                alphabet.add(character)
        return alphabet

    def update_graph(self, new_sequences: list, update_alphabet: bool = True):
        """
        Update the De Bruijn graph with new sequences.

        :param update_alphabet: If set True, adds newly encountered characters to the alphabet.
        If set false, the function will throw ValueError when it encounters a character
        not in the alphabet.
        :type new_sequences: bool

        :param new_sequences: The list of new sequences to update the graph.
        :type new_sequences: list

        :raises ValueError: If the list of new sequences is empty.
        :raises ValueError: Unexpected character.
        """
        if not new_sequences:
            raise ValueError('No new sequences provided!')

        # Add new sequences to the existing sequences
        self.sequences.extend(new_sequences)

        if update_alphabet:
            # Update alphabet
            for sequence in new_sequences:
                for character in sequence:
                    self.alphabet.add(character)
        else:
            # Check for unexpected characters
            for sequence in new_sequences:
                for character in sequence:
                    if character not in self.alphabet:
                        raise ValueError(f'Unexpected character: {character} not in alphabet.')

        # Update the existing graph with new sequences
        prev = None
        for sequence in new_sequences:
            for index, current in enumerate(sliding_window(sequence, self.k - 1)):
                if index == 0:
                    prev = current
                    continue

                # Increment the edge weight by 1 if it already exists in graph
                if self.graph.has_edge(prev, current):
                    self.graph.edges[prev, current]['weight'] += 1
                else:
                    # Create an edge with 1 weight if it does not exist in the graph
                    edge_attributes = {
                        'weight': 1,
                        'tuple': generate_edge(prev, current),
                    }
                    self.graph.add_edge(prev, current, **edge_attributes)
                prev = current


def sliding_window(sequence, window_size: int):
    """
    Generate a sliding window over a given sequence.

    This function takes a sequence (like a list or a string) and a window size,
    and generates a new sequence of 'windows', where each window is a tuple of `window_size`
    consecutive elements from the original sequence.

    :param sequence: The sequence to generate the sliding window over. This should be an
                     iterable like a list or a string.
    :type sequence: iterable
    :param window_size: The size of the sliding window. This should be a positive integer.
    :type window_size: int
    :return: An iterator that yields tuples of `window_size` consecutive elements from `sequence`.
    :rtype: iterator
    """
    it = iter(sequence)

    result = tuple(islice(it, window_size))
    if len(result) == window_size:
        yield result
    for elem in it:
        result = result[1:] + (elem,)
        yield result


def generate_edge(source, target):
    return [source[0] + target[1:]]
Code Demonstration
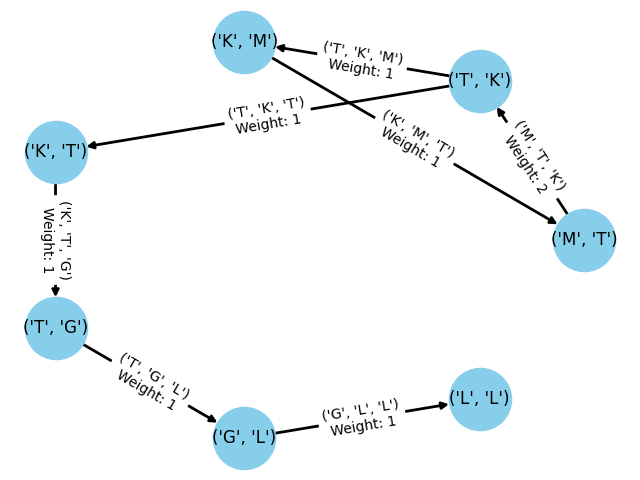
This concludes our implementation. While further memory optimizations are possible, the appropriate optimization varies depending on the graph’s intended use. We can quickly confirm that the code functions as expected by generating the example dBG discussed earlier in this post.
aminoacids = {'A', 'C', 'D', 'E', 'F', 'G',
              'H', 'I', 'K', 'L', 'M', 'N',
              'O', 'P', 'Q', 'R', 'S', 'T',
              'U', 'V', 'W', 'Y'}

dbg = DeBruijnGraph(k=3, alphabet=aminoacids)
dbg.update_graph(new_sequences=['MTKMTKTGLL'], update_alphabet=False)
print(dbg)

>>> DeBruijnGraph with 7 nodes and 7 edges
We can also draw this graph using the following code:
dbg = dbg.graph
pos = nx.circular_layout(dbg)  # positions for all nodes
nx.draw(dbg, pos, with_labels=True, node_color='skyblue', node_size=2000, edge_color='k', width=2)

# Get edge attributes
edge_weights = nx.get_edge_attributes(dbg, 'weight')
edge_tuples = nx.get_edge_attributes(dbg, 'tuple')

# Parse edge labels
edge_labels = {key: f"{edge_tuples[key]}\nWeight: {val}" for key, val in edge_weights.items()}

# Draw the graph
nx.draw_networkx_edge_labels(dbg, pos, edge_labels=edge_labels)
plt.show()